New Tobin’s Q formulas

In the past I reported on a formula that could be used to download the Tobin’s Q ratio for individual companies. Recently, I discovered that two new formulas have been created by Thomson Financial for Datastream which should provide a better solution to get this ratio. These formulas can be found using the search option to find formulas and available functions in Datastream: the Expression Builder or Expression Picker. The button is available below the orange Data Type button:

Using the button you can search for many formulas:

The Expression builder button allows you to search for Version 2 (created in 2015) using prefrabicated Datatype code 168E which represents the formula:

(X(MVC)*1000.000+PAD#(X(WC03451)~PCUR,C)+PAD#(X(WC03251)~PCUR,C)+PAD#(X(WC03051)~PCUR,C))/PAD#(X(WC02999)~PCUR,C)

Running the full expression like you would the previous formula will not work. You will get the error:
$$”ER”, E200, EXPRESSION TOO LONG

The only way to use the formula is by using the mnemonic as the Data Type: 168E

The second new (simpler) version of the Tobin’s Q formula is also available there: X(DWEV)/X(DWTA)*1.000

This version can be used as you would regular (smaller) formulas at the box for Data Types. Example:

An explanation of the different part codes can be found in the Datastream search menu for Data Types. You can find an overview of Data type definitions for the items in the formulas also here.

Email

Using Excel to download the BETA

In a few earlier posts I explained how to use the formula to get the BETA from Datastream using the following example formula:

REGB#(LN#(X/LAG#(X,1M)),LN#(Y/LAG#(Y,1M)),60M)

The formula can be used and in Excel you can generate a list of formula’s. I explained this in a follow-up post. The important thing to remember is that the list you can generate this way can only be used in a Request Table type search.

To make it easier I have now posted an example Excel sheet that allows you to more easily create a list of equities (with the markets/indices). You can download it here.

Please remember that this excel worksheet is just an example! I randomly used equities and indices. When using the formula it is necessary to choose the right list of equities and indices/markets that are right for your research!

Email

Sustainable & Responsible Mutual Funds and other databases

In the past I have posted an item on sustainability funds from the US SIF website with some performance data. The Mutual Funds on the website lists Tickers and names for these funds. The tickers on that website are NASDAQ Tickers. Additional information on these funds can be downloaded from the CRSP Mutual Funds part database Funds summary using a text file of these tickers. At search step2 in the WRDS platform you can choose to upload a file containing mutual fund codes:

In WRDS at step 3 you can choose to download descriptive information. If the CRSP database does not contain enough information you can select items like 8-digit CUSIP of NCUSIP as part of your download. The NCSUIP is the 9-digit CUSIP.
Using these CUSIP code you can search for more information in other databases like Compustat North America and Datastream/Asset4 ESG/WorldScope. In Compustat you can download data by creating a text file with CUSIP codes. This will run fine.

Using CUSIP 9 codes in Datastream (and for databases through datastream, like ASSET4 ESG and Worldscope) requires that the codes are enhanced by adding the letter U in front of each code. This can be easily done using the Concatenate() function in Excel. See example:

Before uploading a list of these enhanced CUSIP 9 codes, make sure to copy and paste the list in Excel to make all these CUSIP codes values! Datastream cannot upload Excel formulas. When you need to upload and work with lists in Datastream you can select the codes using the mouse and then use the Datastream option: Create list(from range):

Email

Going from CRSP & Compustat North America to Datastream

Making a selection of companies/data in different databases can be tricky. In some cases it helps if the owners of a database already did some work for you. In the case of CRSP it is easy to go from this database to Compustat (and the reverse) using the CRSP/Compustat Merged database. Also, in some cases it can be handy to use it to go from a selection in CRSP or Compustat North America and look up data in Datastream.

The important thing is, as usual, the company or listing identification codes. The import codes that you can work with in these databases are the following: GVKEY, PERMNO, PERMCO, CUSIP, Ticker, CIK.

GVKEY = unique company code from Compustat databases
PERMNO = unique listing code from CRSP databases
PERMCO = unique company level code from CRSP databases
CUSIP = unique code for listed companies from the CUSIP bureau
Ticker = Ticker Symbol for listed companies at exchanges
CIK = Central Index Key = unique code for companies registered at the SEC.

The merged database consists of different part databases that you can use to match one of these codes to the other. If you are interested in Company level information the part database you can use from the merged database is the Fundamentals Annual database.

You can start from a selection in Compustat and use a GVKEY list to get the PERMNO or PERMCO codes.
You can also start from a CRSP selection with PERMNO codes and get GVKEY codes.
If you need to go from CRSP to Datastream the merged database is a good way to get CUSIP 9 codes that allow you to search for data in Datastream.


In the WRDS search screen you also try getting a closer match using the Linking options available and the options at “Fiscal Period and Link Date Requirements“. You only need to work with this if the amount of codes in the result is significantly different from the input list. Also, if the original list that you use to search, is an older (or historical list) you may need these options to get matches. See screenshot:

At step three in WRDS you can select the codes you need in your output:

Once you have made your selection (maybe already including financial data) it is a good idea to use the download option at step 4, called: “tab-delimited text (*.txt)“. The downloaded text file can still be used fine in Excel and this ensures that you are in control where company codes are concerned. These codes need to stay in tact if you need to search in another database like Datastream with CUSIP 9 codes. Check another post about working with text files in Excel if you need more information on this.
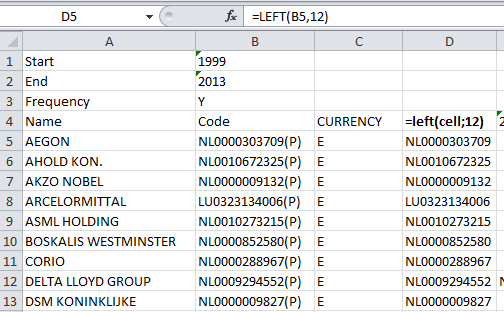
To use CUSIP 9 codes in Datastream you have to add the letter “U” in front of each code: to make it a “local code” that Datastream understands better Alternative: use the text “WS:”). You can use the Concatenate() (= Tekst.Samenvoegen) function of Excel to do this:

If your starting point from CRSP is not only a list of PERMNO codes but dates as well, then you will have to use the VLOOKUP() (= Verticaal.Zoeken) to match original PERMNO codes with dates with the right CUSIP 9 codes. If your starting point is a file like this:

Using the list I removed duplicate PERMNO codes and then did a search in the merged database (Fundamentals Annual part database) to get the CUSIP 9 codes:

As the final step I got the CUSIP 9 codes from that download in Excel with the original list of PERMNO codes + dates using the Vlookup() function (example of this function):

When this was finished I could use the original dates with the needed CUSIP codes (after adding the letter U) in a Request Table search in Datastream to get data from there.

N.B.: You will probably lose some companies from the original file as the PERMNO may not always be matched perfectly using the merged database.

Email

WorldScope coverage update 4th Quarter 2014

WorldScope company records now cover annual reports data for 76995 companies. This includes 46168 active and 30827 inactive companies. This update: 465 companies were added. Because of these additions the number of active companies in the database has gone up 48 from 46098 in September. This is the second update in 9 months’ time that the total number of active companies went up. WorldScope company records are also available through Datastream and LexisNexis.

Today I have updated the WorldScope country coverage file and it now includes the latest update as it was posted in the fourth Thomson Reuters Infostream quarterly publication of 2014.

Major updated Countries (new records):
Australia (16)
Canada (17)
China (28)
Hong Kong (45)
Nigeria (15)
South Korea (43)
Taiwan (36)
United Kingdom (24)
United States (121)

Email

Using Excel for event windows & Datastream

A recent question I got had to do with the event window that a student wanted to use for an event study. For the research model the student wanted price data for three days: the price of a stock on the day before the event date, the price on the day of the event date, and the price the day after the event date. Using a Request Table search in Datastream the price used (in this case) was the default padded closing price: P. On regular weekdays (Mondays to Fridays) the variable P will always provide a price: on bank holidays the price of the last trading day is repeated until a new trading day provides a new price. Using Excel the window can be calculated and the Request table search screen would look as follows:

Unfortunately, using the standard option in Excel to calculate the event window does not help when you need exactly three prices as a window for each equity. The search result would look as follows:

Using the standard option you will sometimes get 1 or 2 prices instead of 3. This is easily explained when you look at the specific original event dates: weekend days will cause missing values. The solution is, to correct for this using the Excel function IF which can be compared to the program function: If .. Then .. Else ..

The Excel formula looks as follows: =IF(Condition, Then X, Else Y)

For more conditions you can use the nested IF and this would look as follows:
=IF(Condition1, Then X, IF(Condition2, Then Y, Else Z))

In the abovementioned scenario of 3 days the formula needs to be used for the starting date as well as the ending date.

Before you want to use the formula, you first need to figure out when you need to correct dates. To do this, you can use the Excel function =Weekday() for the event days. The function will give a value of 1 – 7 for each weekday:
1 = Sunday
2 = Monday
3 = Tuesday
4 = Wednesday
5 = Thursday
6 = Friday
7 = Saturday

The formula I chose for the start date was =IF(F3=1,B3-2,IF(F3=2,B3-3,C3))
It is based on the premiss: if the start weekday falls on a weekend day, I want the price of the last weekday (Friday).

The formula I chose for the end date was =IF(F3=1,B3+2,IF(F3=7,B3+3,IF(F3=6,B3+3,D3)))
It is based on the premiss: with the (recalculated!) start date in mind I need to add 1 or more days to get an event window of exactly three days.

You can download an example in Excel here.

If I now use the new recalculated/corrected dates (with the abovementioned formulas) in a Request table search in Datastream I get Price data for exactly three days. Example search result:

N.B.:
1) The formulas in the abovementioned example only apply to the situation where the event window is exactly three days. If your event window is larger you need different nested IF formulas based on the same principle of Weekdays!
2) When you need to use the unadjusted unpadded (historical) price in Datastream (= UP) you also need different formulas when your model requires an exact number of prices.
3) If a stock is listed on a stock exchange with different weekend days Datastream adjusts this to make prices for all exchanges comparable. See also this blog post.

Email

WorldScope coverage update 3rd Quarter 2014

WorldScope company records now cover annual reports data for 76530 companies. This includes 46120 active and 30410 inactive companies. This update: 358 companies were added. Because of these additions the number of active companies in the database has gone up 22 from 46098 in March. This is the first update in 6 months’ time that the total number of active companies went up. WorldScope company records are available through Datastream and LexisNexis.

Today I have updated the WorldScope country coverage file and it now includes the latest update as it was posted in the third Thomson Reuters Infostream quarterly publication of 2014.

Major updated Countries (new records):
Australia (16)
Canada (14)
China (19)
Hong Kong (13)
Japan (18)
South Korea (16)
United Kingdom (39)
United States (133)

Email

Price data in Datastream and Compustat

There are sometimes diferences when you download similar type data from databases. For example, depending on which source you choose for regular prices of stocks, the result may be different from what you might expect. In this case I am not talking about the possibility that you might get price data in different currencies in a download. Currencies, may also be a reason for surprising result but by carefully studying the database (and including currency as an item in your download) you may easily avoid falling into this trap as price series with different currencies become identifiable.

I recently downloaded prices from datastream using the default (closing) price, which is variable P. The resulting data looked as follows:

Some of the prices appear to be very high compared to others: see highlighted series. The main reason for this is that the standard default variable Price (P) is an adjusted price in Datastream! This means that stock prices are adjusted for stock splits and many other changes to make every price comparable over time. The second main reason may be the act that the Price (P) is padded. Padded means that on workdays that are bank holidays, prices are repeated from the last trading date until a new trading day/date occurs. In essence, on a workday that is not a trading day, you will still get a price.

For some research it may be necessary to use the original, unadjusted and unpadded price from Datastream. In this case you should use the price UP = Unadjusted Price. In addition to using this price you have to add something to the variable to make sure that No Padding takes place. In Datastream you should add the Hash sign and the letter S. The full variable / data type would look like: UP#S
When you now download the original unpadded data the result will look very different:

If you are using Compustat to get your prices for companies you do not need to worry about choosing a type of Price variable in the Security Daily or Security Monthly part databases. There is only one Closing Price option: PRCCD — Price – Close – Daily.
All price data (closing price or otherwise) from Compustat is unadjusted and unpadded! This means that you do not have to use a trick to get this type of price. However, should you want to adjust the price data (for stock splits etc.) you have to also download and use the adjustment factor variable. When you have downloaded these adjustment factor data too, you can start to recalculate prices yourself: Adjusted Price = (PRCCD / AJEXDI ) where AJEXDI = Cumulative Adjustment Factor (Issue) Ex-Date.

An overview of these adjustment factor variables is available in the Compustat manual “Understanding the Data” on page 91 and on (chapter 6). If you have access to Compustat through Wharton you can find the manual at:
> Support > Compustat manuals and overviews

Email

Datastream downloads & data matching continued

In the previous blog item I explained how Excel could be used to match data from Compustat with that from Datastream. The Datastream data download had to be edited to allow for a match with VLOOKUP. There is a way to make it a bit easier to match data from Datastream: by using a specific tool called a Request Table. By using a Request Table you can download the data for each year in the same columns in Excel: each year below the previous year, and so on. In a previous post I explained how to use this tool.

Using the Request Table Tool avoids having to copy the data into a single column when you want to match the data using VLOOKUP. There are three important things to remember when using this tool (in this situation):

1) First you need to upload the selected list of equities to create a list that Datastream can then use for the Time Series List requests in the Request Table search. See the previous post for an example (screenshot)

2) The usefulness of the tool depends on the size of the list of equities. It may take a long time to download a long list using this tool. Also, you need to use an Excel formula to calculate where the next year/download should start. For a list of 25 equities the formula I use would look like the following example where I skip 30 rows before the next annual prices are downloaded (I usually take a few extra rows to be safe): =”=Sheet1!$A”&30*ROW()
See the original post on the Request Table for a full example.

3) Be careful if you need data with a certain frequency. For the example I wanted to get the calendar year end price. The default download period for a regular download needed to be chosen accordingly. For the start date I used 12-30-00 and as the End date: 01-03-01. With the Frequency Annual this worked fine. Had I chosen 1 January and 31 December (for each year) the download would not have been okay (for this example). Example screenshot of the Request table search:

For some years specific equities may not be listed and the download will show the corresponding Error code. Example search result:

As the final step you need to add years for each separate yearly date range. Using the steps from the previous post to get the ISIN codes and then combine them with the years (to create unique ID’s) everything should work fine for the Vlookup option. See example screenshot:

The Request Table search I used in this example can be downloaded here.

Email

Matching Compustat & Datastream data in Excel

Although it is recommended to use the same source for as much of your data as possible, there is not always an alternative. Compustat North America, for instance, allows you to downoad anual report data through the Fundamentals Annual database together with stock prices at the end of the calendar or fiscal year. In this case there is (often) no need to go to another source.
In the case of Compustat Global the Fundamentals Annual part database does not have these two Price variables. In this case you can choose to match data from Compustat with data from Datastream. In the example I use here I used a list of ISIN codes of current AEX index companies from datastream.

N.B.: Important: annual report data is also available through Worldscope in Datastream. In this example I assumed that the starting point for a selection would be Compustat Global.

For the example I created an example spreadsheet where you can see how I combined the data step by step. You can download the example Excel file here.

1) First I used the list of equities to download annual report data from Compustat for the period 2000 to 2012. Example Screenshot (WRDS tab in the Excel file):

2) Next I used Datastream to download the End of the calendar year price. First I uploaded the list using the option in the Excel Datastream add-in: Create List(from range):

Next I did a time series search using the uploaded list (use the List picker button below the orange button Find Series). I chose to download the data Transposed which makes it easy to use the download and making the combination. Transpose = yearly data in the columns. This way I can also choose to download the codes that I uploaded and get them in my output. See screenshot:

The output looks as you see it in the Excel spreadsheet tab Datastream:

3) To match the data from Compustat with the Datastream data we need to combine the ISIN codes with the year to make it unique. First we need to use the LEFT() function in Excel (in Dutch = LINKS() )to create a new column with only the ISIN code. See the example screenshot (= This is tab Stap 1 in the Excel spreadsheet):

4) The problem with the Datastream output is also that the ISIN codes are returned but not for each column of data. We therefore need to copy the data and make sure that the codes and annual columns are copied below each other. For each year we also need to add the year to be able to later generate a unique ISIN+year combination. See the example (= This is tab Stap 2 in the Excel spreadsheet):

5) To create unique ISIN+Year ID codes we can use the CONCATENATE() Excel function (in Dutch = Tekst.Samenvoegen). See the previous example Datastream screenshot (= In Excel see column C in the tab Stap 2 for Datastream and Column A in tab Stap 3 for WRDS) and the WRDS example here:

6) As the final step we can now use the data from Datastream and add it to the WRDS spreadsheet using the VLOOKUP() function (in Dutch = Vertikaal.Zoeken() ). The full formula looks like this: =VLOOKUP(A2,’Stap 2′!$C:$D,2,FALSE). If I break it down it looks as follows:

– Function start: =VLOOKUP(
– Look up content of Cell: A2
– In Sheet Stap 2 look for value in cell range columns C and D: ‘Stap 2’!$C:$D
– If there is a match show the value in the second selected column (= column D): 2
– Only return a value if the match is exact: FALSE.
– Function close: )

N.B:
A) The elements in the VLOOKUP function are divided by comma’s. In the Dutch language version of Excel those would be semi-colons ( ; ).
B) In the example above I used Dollar signs to fixate the cell table range: $C:$D. It is not always necessary to do this in a VLOOKUP function. They also do not automatically appear when you have selected the table-range. You can automatically add them in the formula using function key F4 or by typing them in.

In the tab Stap 4 of the Excel spreadsheet you see how this works:

Email