Workspace Excel addin and events

When you get access to LSEG Workspace it may be that your account does not cover all options for the Excel addin. Typically, for student accounts, the Datastream part will not work when you try to use this. This may be inconvenient when you want to do an event study since you do not have the option of a Request Table download. This Datastream Excel addin feature was built to do downloads of this kind.

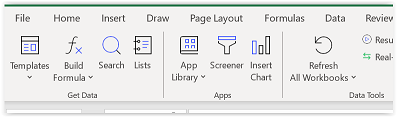
The main feature that is available for time series downloads (in the Excel addin) is the Build formula button.

The main drawback of this feature, is, that it is not directly possible to do downloads for multiple equities for multiple time windows, in one go. Using this feature and changing some Workspace codes, however, will allow you to still to targeted downloads for specific varying windows.

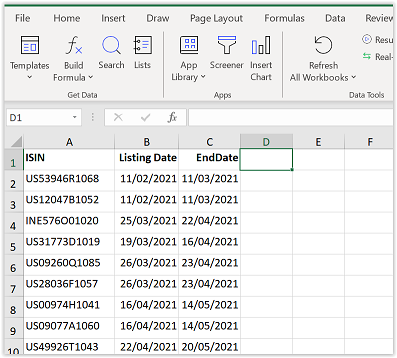
Step 1) Gather data on events with beginning and end dates
In this example I use ISIN codes. It is also possible to use RIC Codes (proprietary Reuters Identification Codes), Sedol codes and CUSIP 9 codes.

Step 2) Do a time series download for the first event in the list
Use the Build Formula option for this. Make sure to use to change the layout to download the data transposed. In this example I choose to download price data. The formula now looks as follows:
=@RDP.Data($A$2;”TR.PriceClose”;”Frq=D SDate=#1 EDate=#2 RH=IN;Fd CODE=ISIN”;E2;$B$2;$C$2)

Step 3) Change the Workspace formula in Excel
This will allow you to copy the formula downward for the other events. The main thing, is, to remove the dollar signs in the formula to avoid absloute reference points. It should look as follows:
=@RDP.Data(A2;”TR.PriceClose”;”Frq=D SDate=#1 EDate=#2 RH=IN;Fd CODE=ISIN”;E2;B2;C2)

Step 4) Copy the formula down for all events

Step 5) Use the button Refresh Worksheet
This option is visible when you change the default button in the Workspace ribbon. The default option is “Refresh all Workbooks”. By clicking the arrow below this you can change it to “Worksheet”. This is to avoid re-downloading data in other worksheets in Excel. The result should look as follows:

Short example movie that shows all the steps in sequence:

Workspace SDC and using ID lists

Last year all users of the “Old” Windows based SDC software were required to move to the new LSEG Workspace SDC (Excel Add-in). The past few months I have been getting used to the new interface for SDC. Luckily enough most of the features look very similar to the older edition and the Excel add-in offers no data limits (like before) it seems.

SDC has several parts, which include an IPO dataset, an Mergers & Acquisitions dataset and a Private Equity dataset. There are more datasets but these are most often what students and researchers are interested in. One of the search features, that is available for several datasets, is, the option to upload a list of identification codes. This option allows you to search for data on specific companies / equities. The ID’s depend on the dataset but can include: Ticker codes, Cusip codes (6 or 8/9), Sedol codes, and Datastream codes (from LSEG).

This feature has changed as more ID search fields are sometimes available. What I have noticed, however, is, that not all the variables can be used this way anymore. Even clicking on the variable may cause an error to pop up:

I have not has time to investigate all datasets but where I encountered the error I have reported it to LSEG. The company helpdesk did some fact finding and acknowledged that there was a problem. I am glad to say that I have received an email indicating that the problem(s) will be solved with an update on April 22nd. Until that time, please be aware that not everything may work as intended.

LSEG Workspace: SDC data and panel data lists

The database Workspace is owned by the London Stock Exchange after the acquisition of Refinitiv. (formerly Thomson Reuters or Reuters financial). I have created a few new Youtube tutorials that may help expedite this.

The new movies are the on the following topics:

The first movie explains how to use LDEG Workspace as efficiently possible to work with SDC data. This may matter if there are data limits. The second movie explains a second way to download bulk time series data using a different option then the Datastream Excel addin option. The Excel addin from Workspace also includes the Eikon download option. This option may allow downloads for variables that are not downloadable through the Datastream option. Additionally, the download is more customizable. This can be convenient if the data needs to be panel data as the format.

LSEG Workspace

The database Workspace is owned by the London Stock Exchange after the acquisition of Refinitiv. (formerly Thomson Reuters or Reuters financial).
Some major changes are taking place where it comes to the availability of databases at the university where I work. To help make the transition to LSEG Workspace as easy as possible I have created a few Youtube tutorials that may help expedite this.

The movies are the following:

EBA Payment Institutions Register data

Today I have finished testing a first version of a Python script that is created to process Payment Institutions Register data from the European Banking Association (EBA). It is based on two downloaded json files from the website of the Payment Institutions Register and each download contains the full register. This includes both active and inactive entities.

The script is intended to make it easier to use the data from the register and (perhaps) merge it with other datasets. Three separate files are created as output:

  • A CSV with some basic Register information on the Entities in the EBA Register
  • A second CSV that contains up to 14 fields with properties for the entities
  • A third CSV file that has the information on where the active Entities are active: which countries and what services are provided. The services information is very basic and is based on Annex I to PSD2 and issuing electronic money under EMD2.

More background information is available on the EBA PIR Register website. I have published the script through my GitHub page. The size of the PIR Register seems to have increased a lot since the initial download in 2021. At that time it contained information on approx. 184.000 entities. When I did a new download on 15 September of this year that number had increased to 258.000. It has also caused the script processing run to increase from 5 to 11 hours.

CRSP US Indices will start using the UES classification

The Intercontinental Exchange (ICE) and The Center for Research in Security Prices (CRSP) yesterday announced the change for it’s US indices through separate media: a newsletter and press release. This will make sure that the US indices from CRSP follow the proprietary UES classification system from ICE instead of the ICB classification.

The Industry Classification Benchmark (ICB) is an industry classification taxonomy launched by Dow Jones and FTSE in 2005. The ICB is used globally to divide the equity market into increasingly specific industry categories. The ICB system replaced the legacy FTSE and Dow Jones classification systems. An overview of the consequences of the introduction of the ICB at that time can be found at the CRSP website.

The Uniform Entity Sectors (UES) methodology from the ICE is a schema that is used for the entire US market: equities, corporate bonds and government securities. The UES system was designed in 2019 and it provides five levels of granularity with 14 Entity Sectors, 27 Entity Industry Groups, 73 Entity Industries, 118 Entity Sub-Industry Groups and 273 Entity Sub-Industries. Each classification level provides both a coded value and description. A full explanation of the classification is available at the ICE website. A direct link to the PDF reference document is available (t)here.

Python projects and GitHub

Not too long ago I started learning and working with Python. It seemed a popular language and I keep hearing about it more and more. Some platforms offer the option to connect to them and download data using software like Python (WRDS). Other database owners or platforms even have built an environment within their platform to make use of it (LSEG Workspace’s CodeBook).

Programs like Stata 17 and up make it possible to use Python from within it’s program interface. Recently Microsoft announced their it’s plans to allow Python to be used from Excel (within Microsoft 365). This will make powerful Python options like Pandas, Numpy and data visualization options to be available there.

I have started making test programs and using and adapting existing programs. Some of my efforts can be found at this blog. I have started to share some code now through the platform GitHub and make these files available and free of use. In the future I will post programs there for people to use and adapt on their own: GitHub Repositories.

TruCost ESG data from Compustat (Capital IQ)

The database TruCost ESG has data on many different aspects related to Environment, Social, and Governance for both listed and unlisted companies. Historical data availability depends on the type of subscribed TruCost licence that an organization has paid for.

The data is basically organized in a pyramid format with at the top the ESG Global score, the three main dimensions underneath, and below that specific related aspects. The bottom row of data points is impacted by data from the RepRisk database. The RepRisk data mainly concerns how the reputation of a company is impacted by news on ESG-related subjects. In effect, this is called the Media & Stakeholder analysis part of the TruCost database. This part is based on the data of another database, called RepRisk. This database mainly tracks ESG type subjects on companies to determine the impact on a company’s reputation.

In many cases you get more then one type of score for a specific year for a company. This is the same for all levels: global, dimension or aspect scores. This has to do with how the data is collected and processed for companies. The score type is indicated by the CSA Score Type Name. Initially the scores are based on raw data. After processing the data according to the CSA model, you have modelled data. The Assessment year will indicate what year the data and scores are about.

Warning: WRDS and Two-Factor Authentication

WRDS is a company that offers a platform to use many financial and economic databases. Examples are: CRSP, Compustat, NYSE intraday data and Audit Analytics. Recently it was announced (quite suddenly) that people who use the Wharton Research Data Services accounts for the WRDS platform, will be required to change the way they get access. WRDS account users will need to use either an App from Duo Security (CISCO) or another way to indicate that they are the rightful users of the account. In essence Two-Factor Authentication (2FA).

Details are explained on the WRDS platform at and FAQ and on the general pages. The change will start at 28 November 2022. The only WRDS type accounts that will not (yet) be impacted by this new policy, are the WRDS Class type accounts. At some organizations that have a WRDS license it is also possible to use the WRDS platform through a WRDS Day Pass option. The new policy will not impact Day Pass users.

In 2023 the 2FA policy will also impact the WRDS account users that use programs like SSH, SAS, R and Python to access licensed data directly from WRDS servers. The specifics on how this works will be disclosed at a later date. The precise date in 2023 is not yet disclosed either.

Research & Collecting Twitter data

A while ago I got a question from a student asking for help with collecting Twitter data for a research project using the Stata program. At first, I tried to figure out how this would work through the Twitter developer API but I soon decided that other options, not involving the limitations of this option might be out there.

Some searches on the internet quickly pointed me to a Python solution that is called snscrape. A youtube movie by “AI Spectrum” demonstrated how this Python social media scrape tool worked. After demonstrating this tool and how easy and free it is to use, the student was able to continue on with the research. Here is the example script I made based on the Youtube video (for reference).

After doing some testing I figured it would be easy enough to build a new script that makes it easy to do two types of Twitter downloads: Tweets collected using Twitter accounts, and Tweets collected based on subject searches. Eventually I also decided I wanted to build in the choice to either do downloads for x number of days backwards or to do downloads for a specific period of time. You can download the end result here.

The zip file also contains two extra plain text files that should be used in combination with it:

  • a file with a list of twitter accounts
  • a second file with a list of subjects

You will have to change some stuff to make it work on your own computer:

  • Make sure the locations for the files are correct for your computer
  • Import all necessary Python modules

For the development I use the PyCharm program. If you need to add the modules used in Python for the script to run, this can be done through the Pycharm Menu > File > Settings
At the option that indicates the Python interpreter used you can add packages like snscrape using the + button. See the arrow / mouse option in the middle of the screen:

N.B.: The python module also can be used for collecting data of other social media platforms: Facebook, Instagram, Reddit, etc.